Eruda - Access a web developer console to debug your website
-
Eruda is a javascript tool that displays a web developer console directly in the website itself. This allows it to be used to debug errors on other devices, such as the Switch, WiiU, 3DS, etc.
To use it, embed it on the page like this:
<script src="https://cdn.jsdelivr.net/npm/eruda"></script>
<script>eruda.init();</script>
And then click the gear icon in the bottom right of the page. This is really useful if investigating errors that only occur on the device, and no web console is available.
Docs / more info:
https://eruda.liriliri.io/docs/Screenshot:
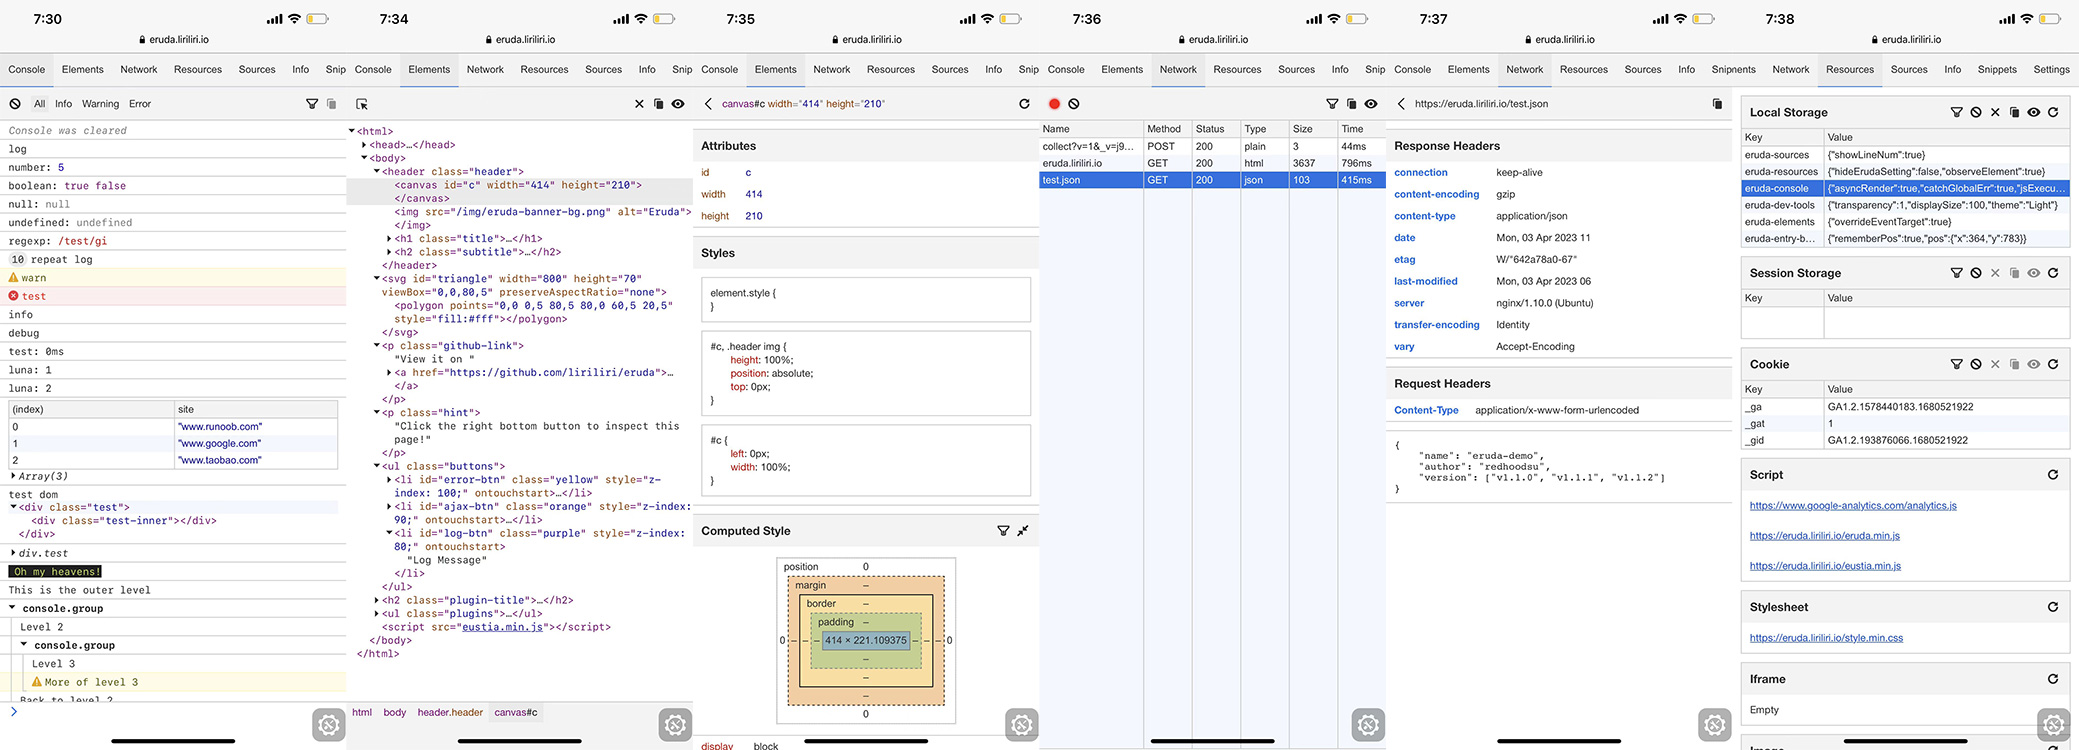
-
Looking on the website, you could also create a bookmark with the url set as
javascript:(function () { var script = document.createElement('script'); script.src="https://cdn.jsdelivr.net/npm/eruda"; document.body.append(script); script.onload = function () { eruda.init(); } })();, and then click on the bookmark on the page you want to inspect. -
Jaiden's Bus Belt to ass Murder Drones Fans The OG FNaF fans ☆ 😈Hellverse A Minecraft movie fans Anti Cringe 67 mustard bluds マインクラフト . bcg fan club! Gay People •Cat Gang• i <3 my computer Eeveelution Fan! South Park Roleplayers! Femboy :3 ★уuмеshiррея♪ Silliest Goobers Gets hated on 67 overlord here BDNS DATABASE car enthusiasts Demon slayer Fan shrub cult krendrick lamar Food Lovers Dead Char 🌹 conspiracy theorist Edd Enhypen Lovers Internet Troll Donut's Box Fans of Star Wars 💖✨Certified Gay Person✨💖 Minecraft Pros Damn is 😂🎉 toetickler victim STRNGER THINGS FANS roblox ANTI FURRY HATTERS Hazbin Hotel Fans Glitch-Production Bcv army Gang Dark Humor Club Free Andy rip andy ✝|-) Christianity (-|🙏 👼Child Of God ✝️ Knives Chau Fan-Club GrilledCat gang
why would u want t=o do this
Hmmm I don’t know
SW 3567-8243-3413
Second SW 2763 5363 9997
My life, my rules, my style, my attitude you love me or hate me. I don’t care. -
@Larryfire85 This is for web developers! For example, I used this the other day for troubleshooting forum issues on Switch, where there's no browser console.
-
Looking on the website, you could also create a bookmark with the url set as
javascript:(function () { var script = document.createElement('script'); script.src="https://cdn.jsdelivr.net/npm/eruda"; document.body.append(script); script.onload = function () { eruda.init(); } })();, and then click on the bookmark on the page you want to inspect.@TheAndyboi That's really cool! Reminds me of the firebug lite bookmarklet, which used to be one of the only reliable ways to debug mobile websites: https://css-tricks.com/snippets/html/use-firebug-in-any-browser/
-
Hey quick question bout this... is it possible to customize the frontend for using eruda? using smth like CSS? or SCSS? along with html and vanilla js?